Martech Stack Audit: How to Diagnose a Bloated Tech Stack
Most GTM leaders can name every tool in their stack. Few can tell you what each one actually does anymore, who owns it, or whether it is worth the renewal. That gap is what turns a reasonable martech stack into a bloated one.
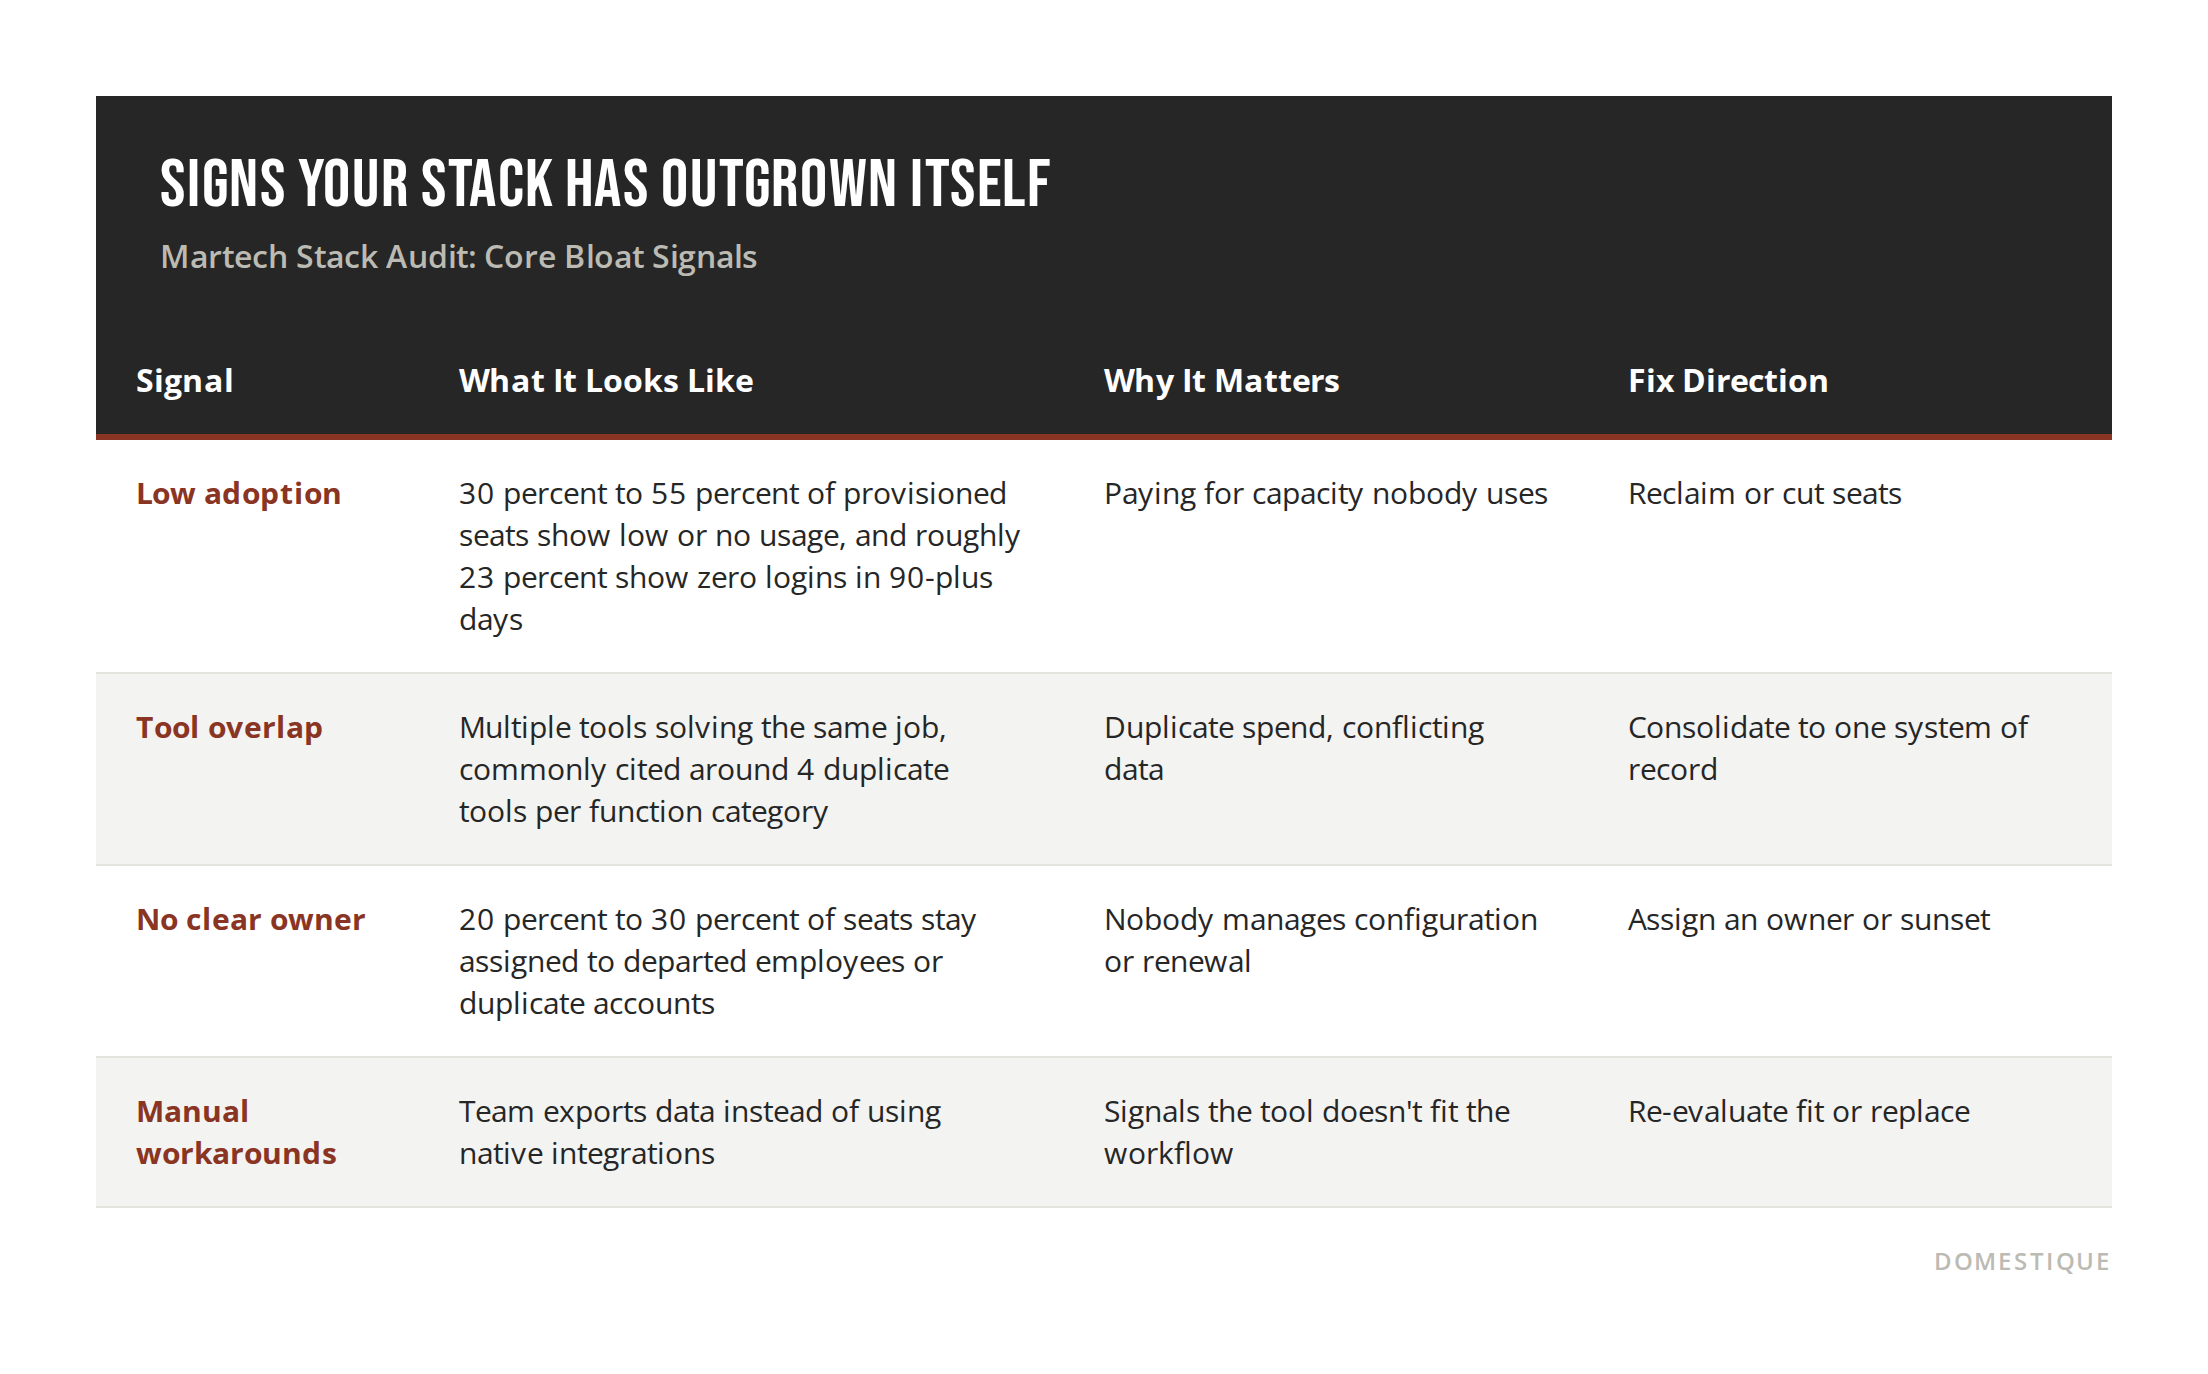
Stack bloat rarely happens on purpose. It builds up one point solution at a time, usually added to solve a single team's problem without anyone stepping back to check for overlap. A year or two later, you are paying for three tools that do roughly the same job, none of them fully adopted, and nobody remembers why the second and third ones were approved.
A GTM tech stack audit is how you find that out before your next renewal cycle forces the conversation. This article walks through a practical framework for diagnosing bloat, the data you need to see it clearly, and what to do once you know where the waste is.
In this article, you will find:
The core signals that separate a healthy stack from a bloated one
A framework for scoring each tool in your stack
How to calculate the real cost of redundant tools
What to do with the results once the audit is done
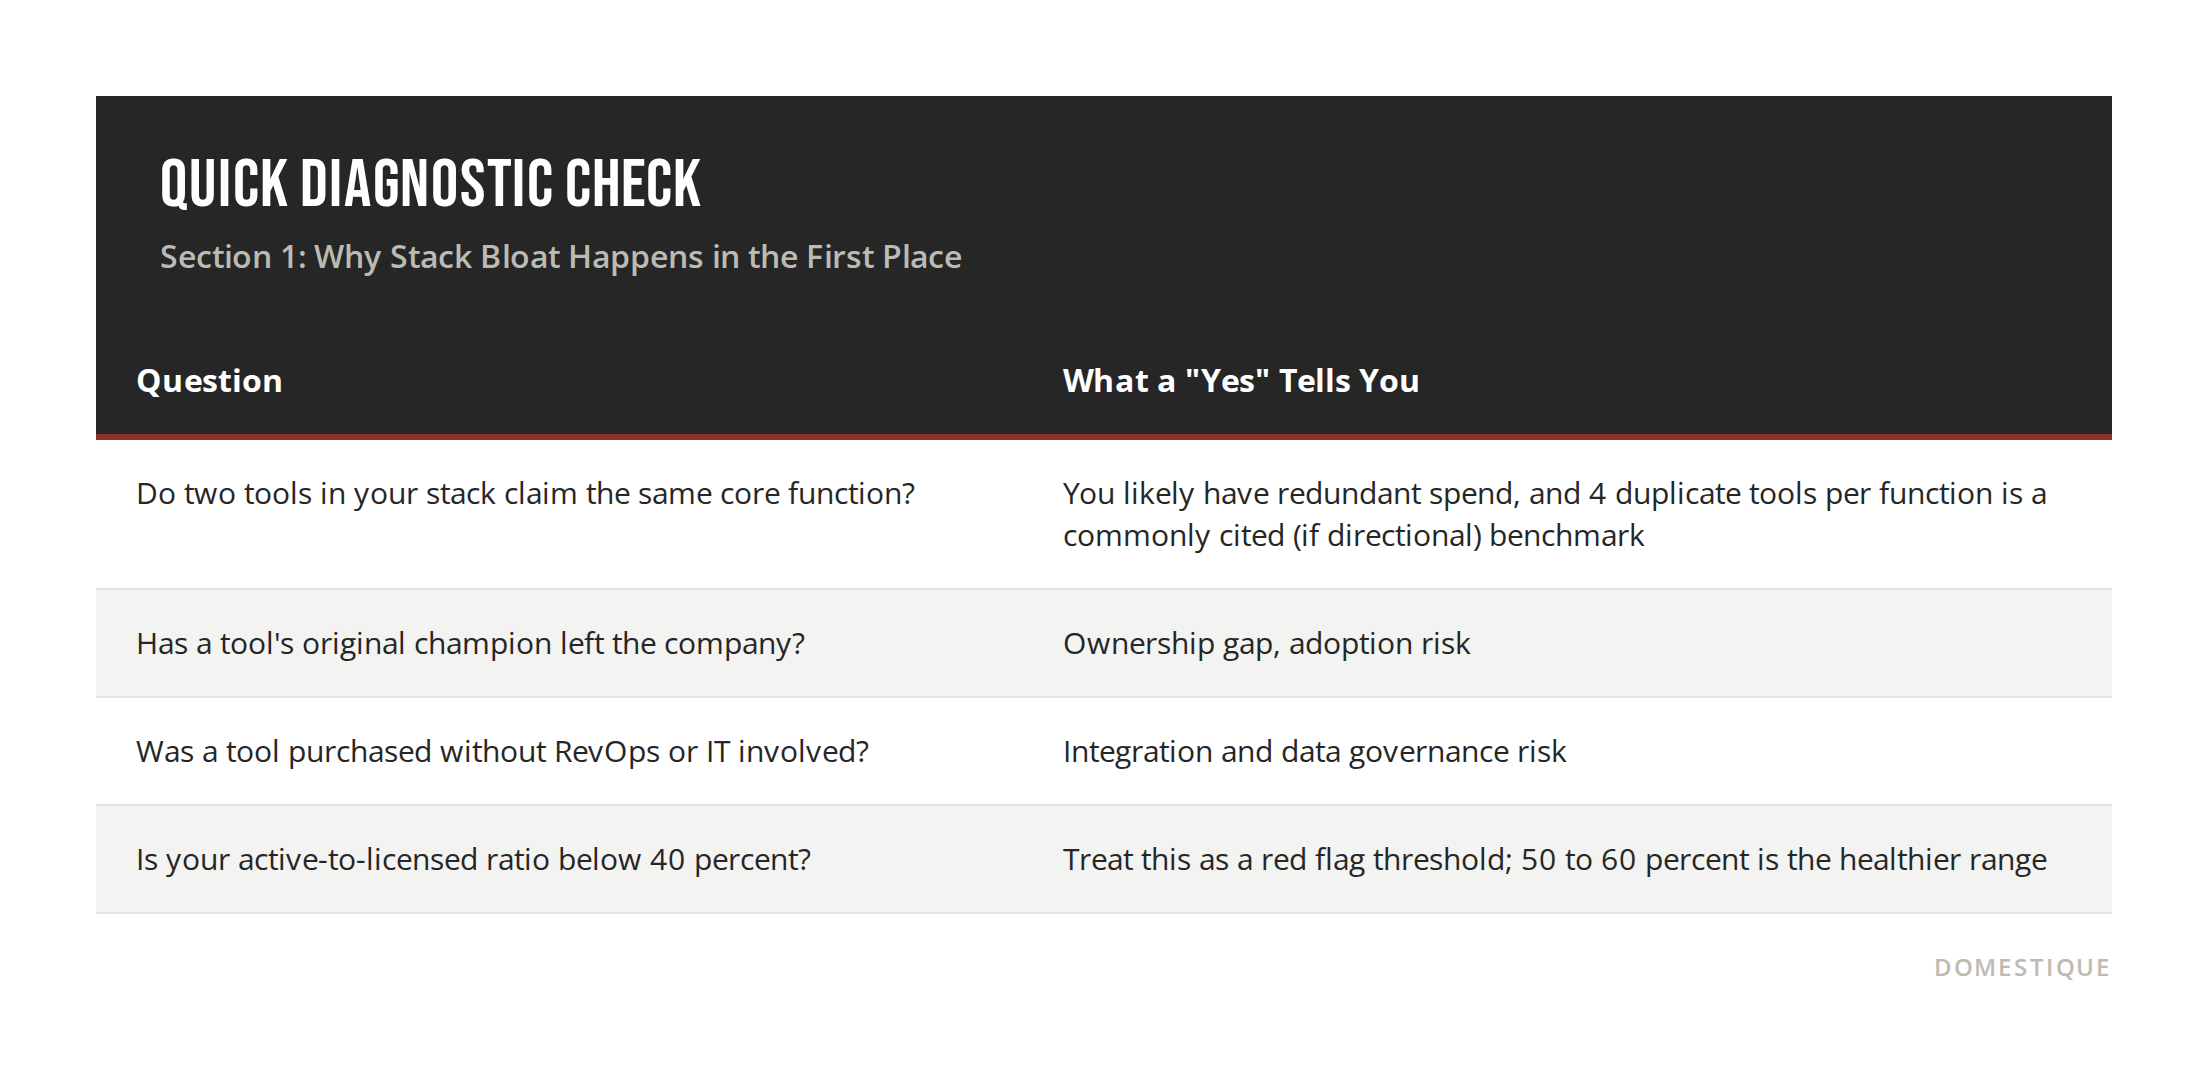
Section 1: Why Stack Bloat Happens in the First Place
Bloat is rarely a single bad decision. It is the accumulation of many reasonable ones made without a shared source of truth. A sales team adds an enrichment tool. Marketing adds a separate one six months later because they did not know the first existed. Both get renewed automatically because cancelling requires more effort than approving.
The pattern accelerates during growth. New hires bring tools from previous roles. Departments buy independently to move faster than a centralized process would allow. Stack size tends to track company stage: early-stage teams typically run 10 to 20 tools, mid-market companies run 25 to 50, and enterprise organizations often exceed 60. Most B2B SaaS companies land in a tighter 10 to 15 tool range across outbound, inbound, CRM, enrichment, analytics, and communication. Interestingly, Series B companies have started bucking the growth trend, with stack size compressing as orchestration platforms absorb functions that used to require standalone point tools.
Section 2: How to Score Every Tool in Your Stack
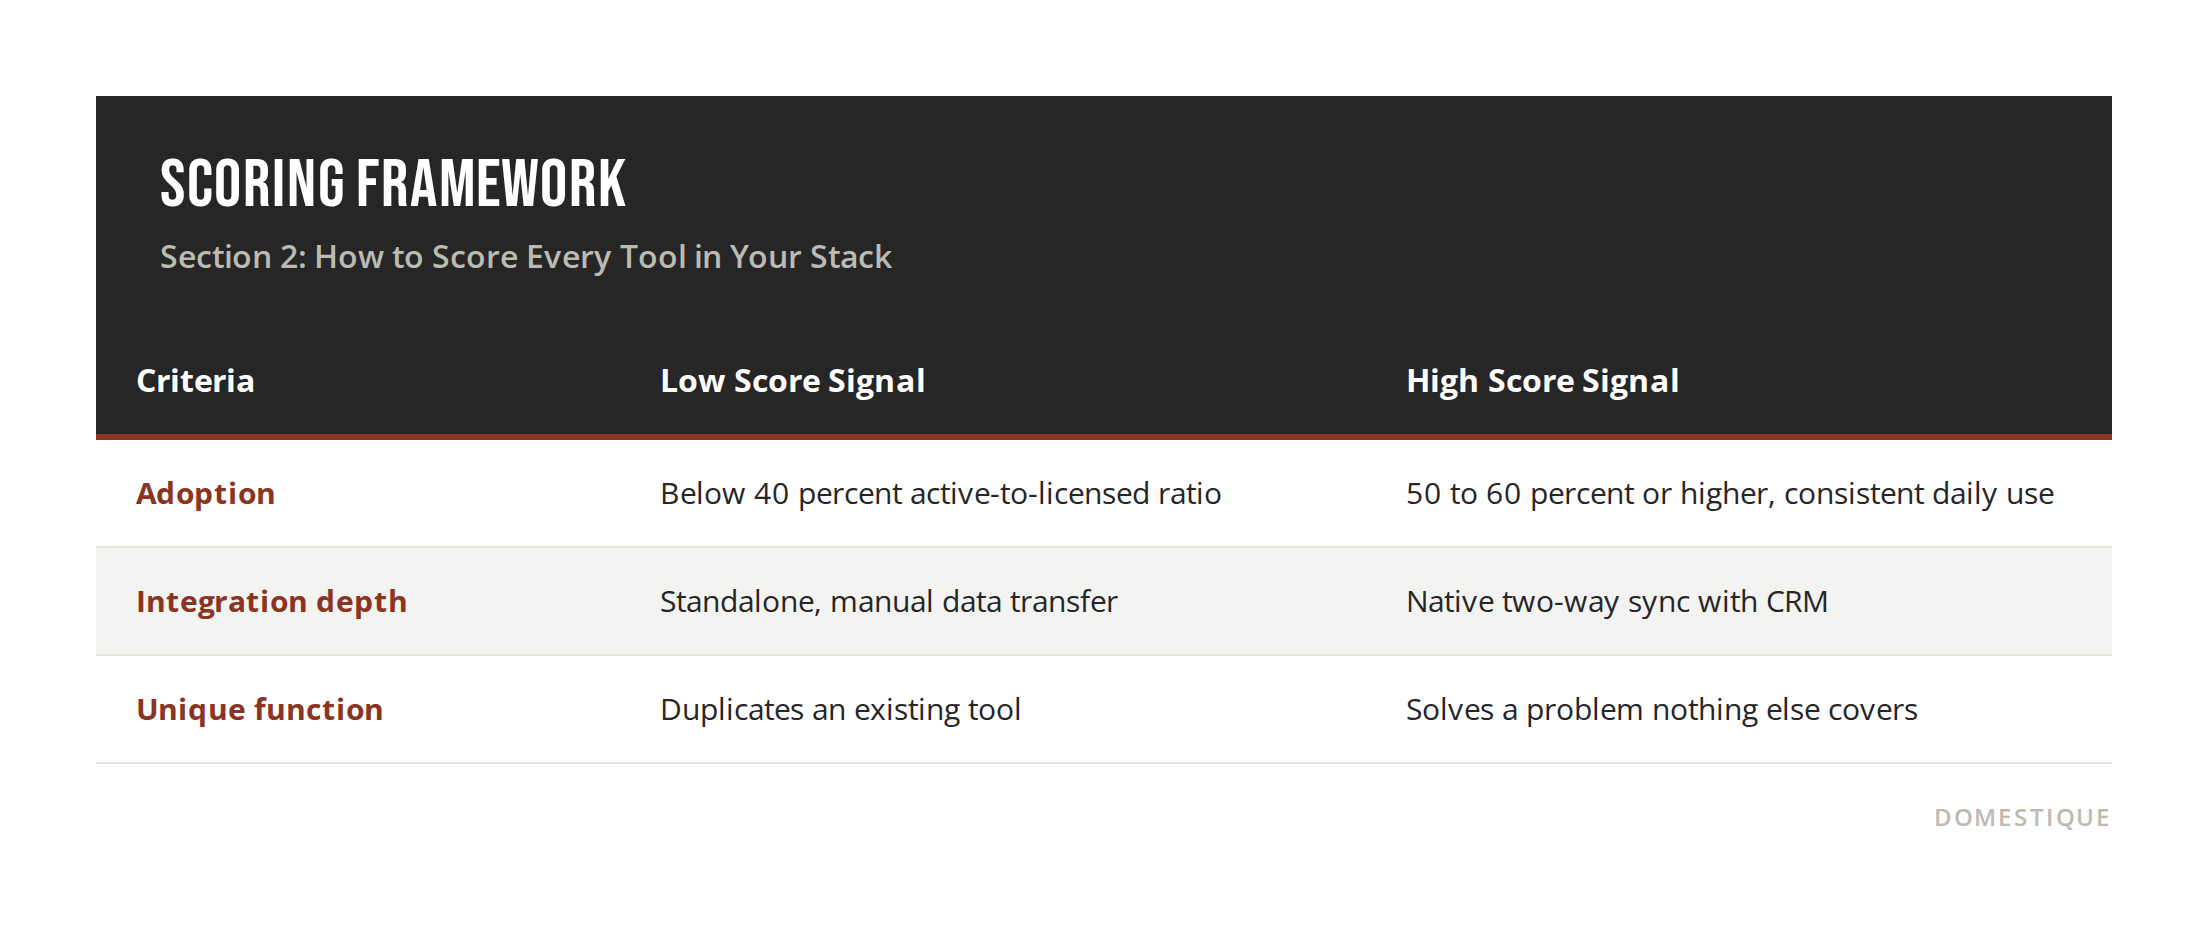
Once you have a full inventory, score each tool against three criteria: adoption, integration depth, and unique function. A tool that scores low on all three is a strong cut candidate. A tool that scores low only on adoption may just need a rollout push rather than a cancellation.
Waste is not evenly distributed. Analytics tools run around 54 percent waste, CRM seats around 44 percent, and enterprise-tier licenses waste more than basic tiers, 47 percent versus 38 percent. In practice, that means analytics and intent tools are usually your first cut, with CRM seats close behind. On feature usage depth, Gartner's Marketing Technology Survey has swung between 33 percent and 58 percent utilization since 2020, which is a wide enough range that it is better treated as a directional signal than a precise benchmark. The more telling number underneath it is that only about 15 percent of organizations qualify as martech "high performers," meaning they can both hit strategic goals and prove ROI on the stack.
Section 3: Calculating the Real Cost of Bloat
The license fee is the smallest part of the cost. The bigger cost is the time your team spends reconciling data across systems that do not talk to each other, and the decisions made on incomplete or conflicting reports because nobody trusts a single source of truth.
To get a real number, add license cost, admin hours spent maintaining the tool, and the cost of any workarounds the team has built around it. The credible savings band from structured audits sits at 20 percent to 40 percent of total stack cost, with well-run SaaS management programs commonly reporting 20 percent to 30 percent in year one from eliminating redundant apps and right-sizing seats. Some vendor research claims teams that cut from 12 to 15 tools down to 5 to 7 see 30 percent to 50 percent total stack cost reduction. Treat the upper end of that range with some skepticism given the source, but the lower, better-substantiated 20 percent to 30 percent figure holds up on its own from right-sizing before renewal alone.
The number that tends to land hardest in a budget conversation is per-rep tooling cost. Gartner's 2024 Sales Technology Report puts license fees alone at $1,300 to $2,800 per month for a mid-market sales rep. Most teams have never added that up rep by rep, and doing so is often the fastest way to get budget buy-in for an audit.
What to Do With Your Audit Results
An audit is only useful if it leads to action. Rank cut candidates by dollar impact and disruption risk, sequence consolidations so no team loses a tool without a replacement in place, and set a recurring review cadence so the stack does not quietly bloat again in twelve months.
FAQ
Q: How often should we run a GTM tech stack audit? A: Most GTM teams benefit from a full audit annually, with a lighter quarterly check on new purchases and renewal dates. Fast-growing teams or those integrating an acquisition should audit more frequently.
Q: What's the difference between a martech stack audit and a tech stack consolidation project? A: The audit is the diagnostic step. It tells you what exists, what overlaps, and what is underused. Consolidation is the action that follows, where you actually cut, merge, or replace tools based on what the audit found.
Q: Who should own the tech stack audit? A: RevOps is best positioned to run it, since the function typically has visibility across sales, marketing, and customer success tools. Without a dedicated RevOps function, this should sit with whoever owns your GTM systems architecture.
Q: How do we know if a tool is worth keeping even if adoption is low? A: Low adoption does not always mean cut it. Check whether the tool serves a small but critical use case, like a compliance requirement, before treating low usage as a signal to sunset.
Conclusion
A bloated tech stack rarely announces itself. It shows up as rising software spend, teams working around systems instead of with them, and reporting nobody fully trusts. Running a structured audit gives you the visibility to see exactly where that is happening and the evidence to make a confident case for consolidation.
The teams that get the most value out of this exercise treat it as a recurring discipline, not a one-time cleanup. Once you have a clear picture of what your stack actually does, you can start building toward a leaner, more integrated GTM architecture.
Get Your RevOps Maturity Checklist to see how your GTM tech stack measures up against a proven benchmark.
Sources:
Zylo, "SaaS Management Index" (2026 edition, license utilization benchmark data)
Gartner, "Marketing Technology Survey" (2020 through 2025 editions, feature usage depth data)
Gartner, "2024 Sales Technology Report" (per-rep tooling cost data)