RevOps Strategy & Frameworks: How to Build One That Actually Sticks
You've sat through the strategy offsite. Everyone nodded at the slides, agreed on the priorities, and three months later everyone is back to doing exactly what they were doing before the RevOps framework existed.
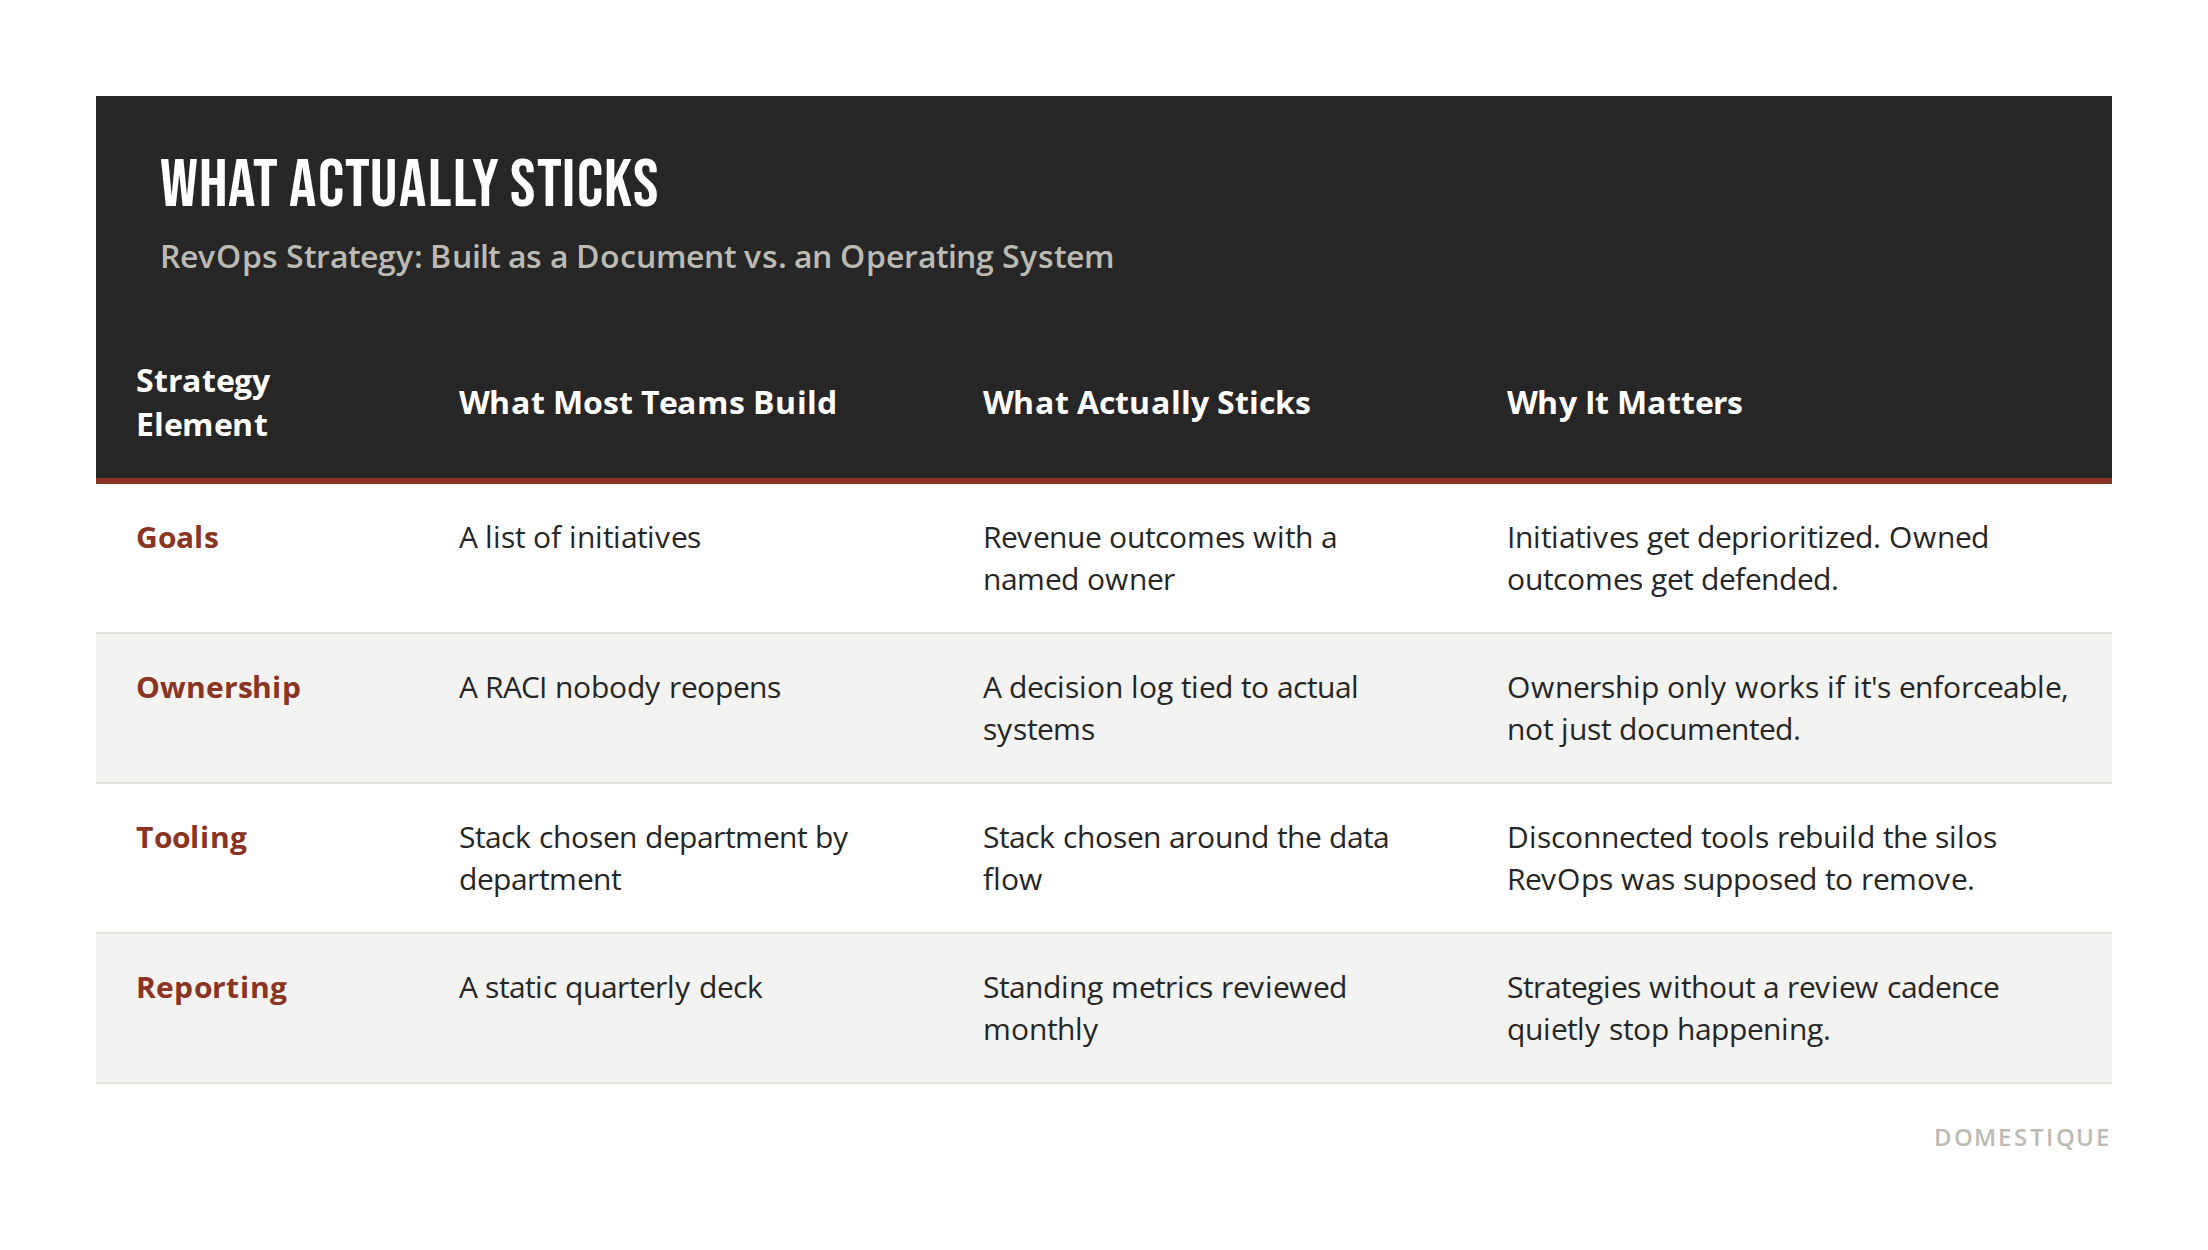
That happens because most RevOps strategies are built as documents instead of operating systems. They describe what should happen without changing who owns what, what gets measured, or what gets funded next quarter. The stakes are real: Gartner research puts the share of sales organizations hitting 90%+ forecast accuracy at just 7%, and Clari Labs found 87% of enterprises missed their revenue targets in 2025. A strategy that never changes daily behavior is a big part of why.
This article breaks down what actually separates a RevOps strategy that gets adopted from one that gets filed away, and gives you a framework you can start applying this quarter.
In this article, you will find:
The four components every durable RevOps framework needs
The ownership mistake that quietly kills most strategies
How to write goals that survive a reorg or leadership change
The handful of metrics that tell you if the strategy is actually working
Start With Four Components, Not the Slide Deck
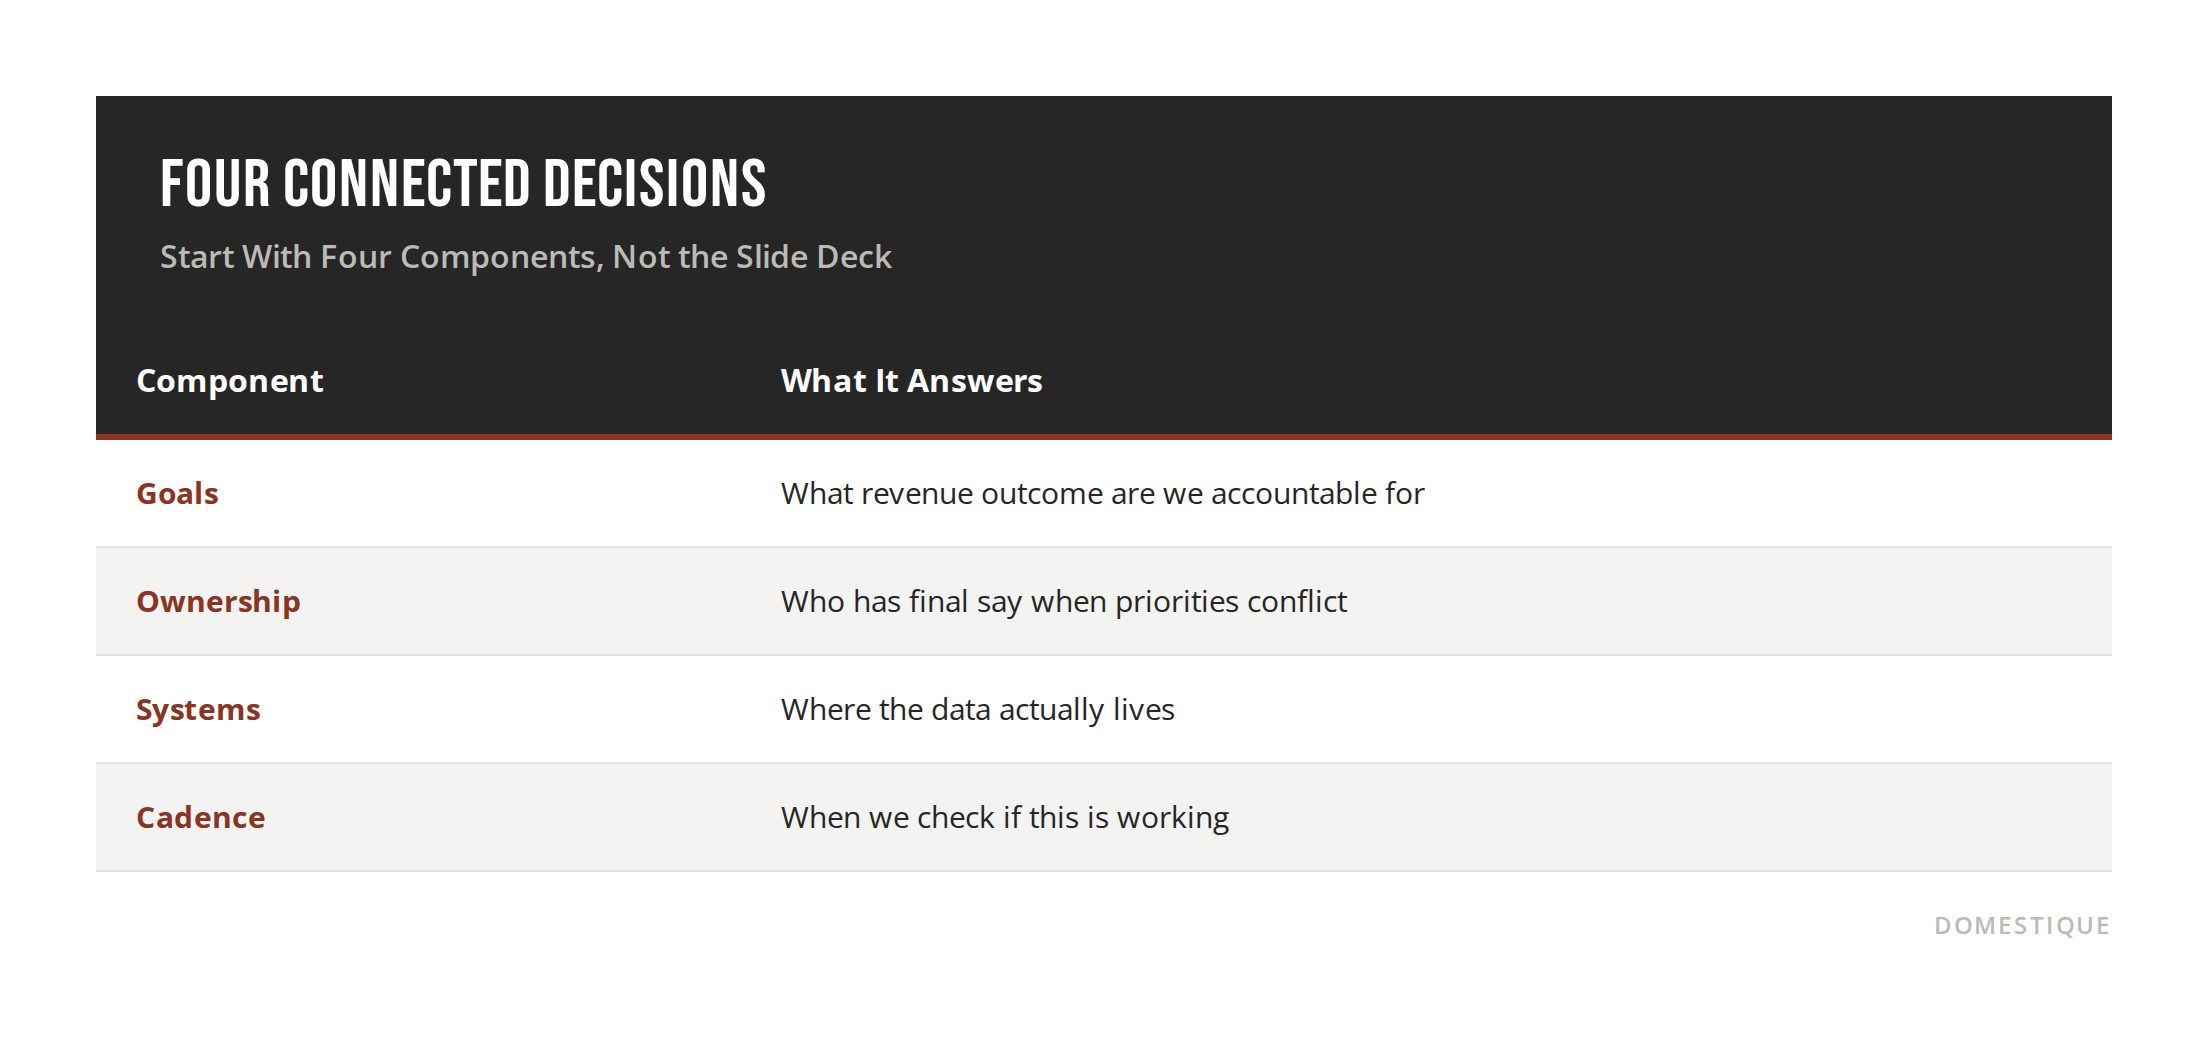
A RevOps framework isn't a philosophy statement. It's four connected decisions: goals, ownership, systems, and cadence. Skip any one of them and the rest becomes decoration, because there's nothing forcing the organization to act on it.
There's no published industry benchmark tying single-owner accountability to faster deal review or shorter cycle times. That's a pattern we see repeatedly in engagements, not a stat you'll find in a report, and it's worth saying so plainly rather than dressing it up as one.
The Ownership Mistake That Kills Strategy Early
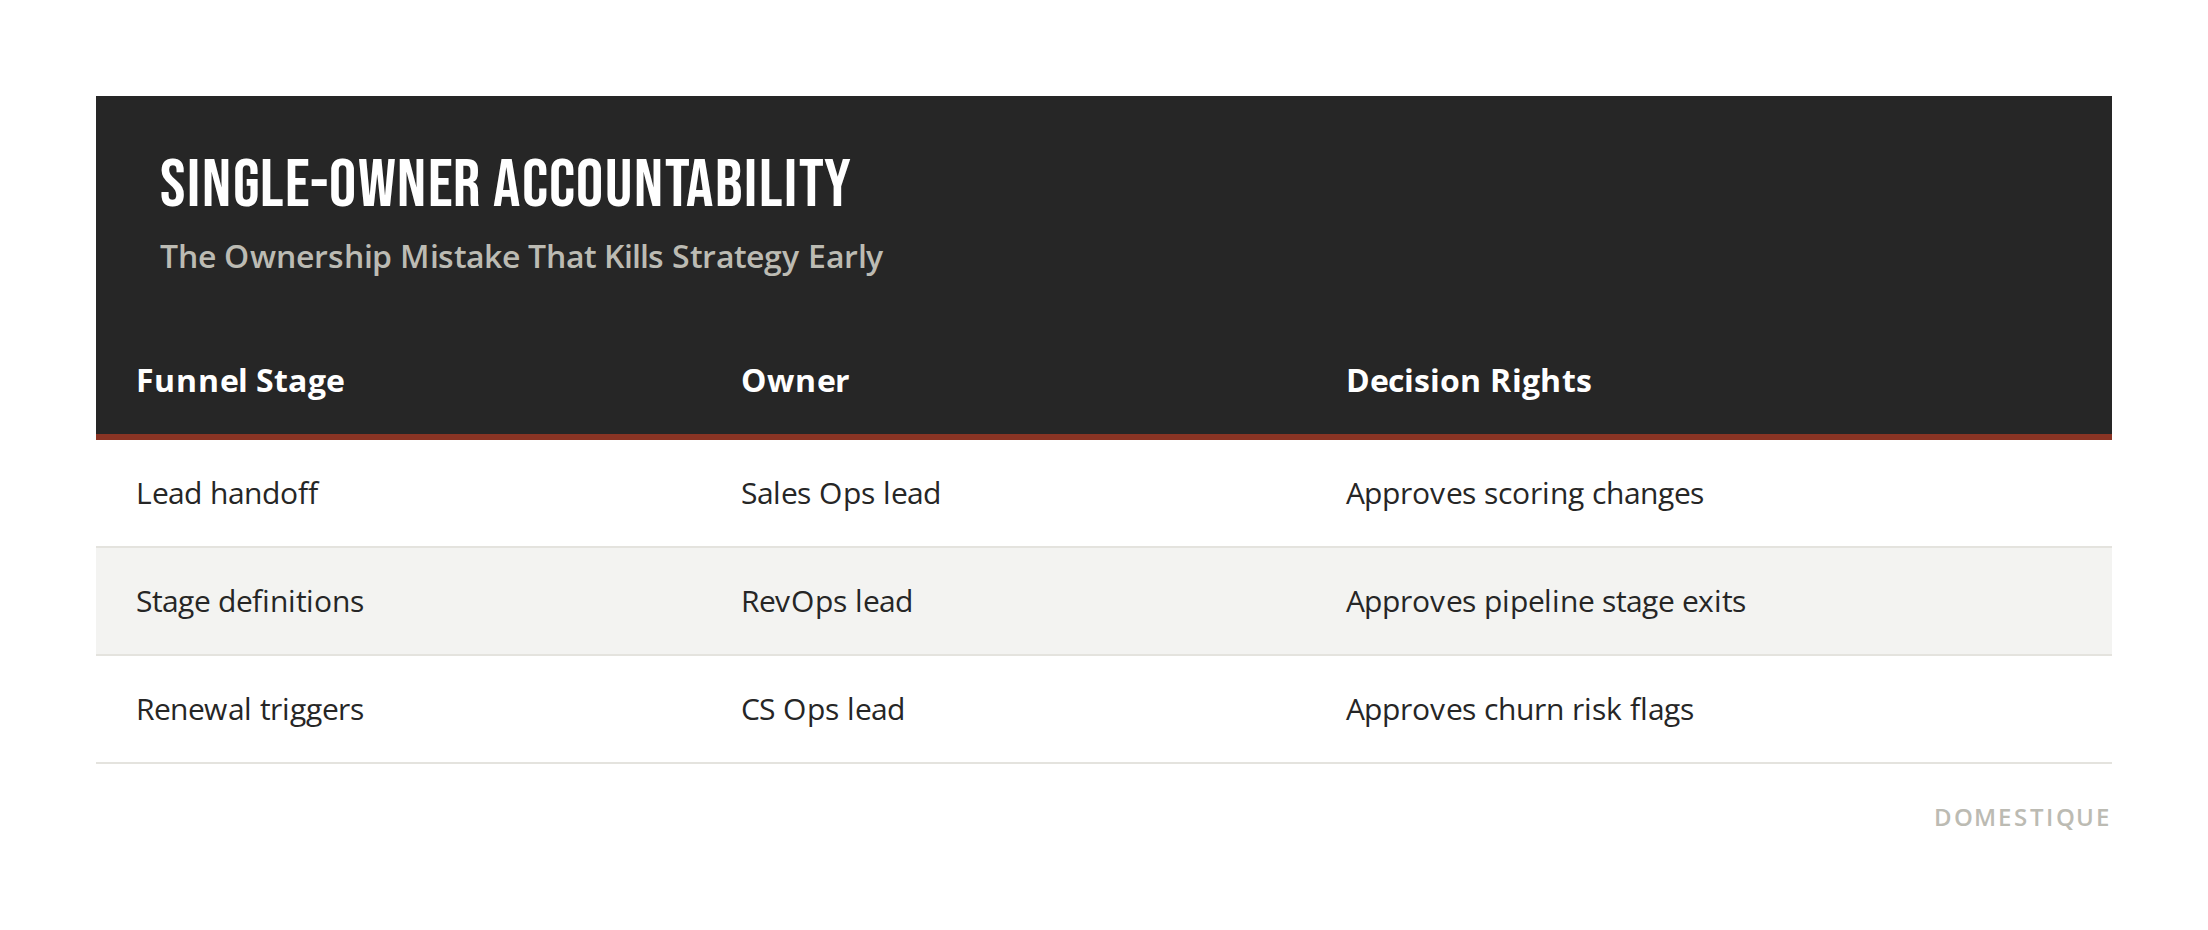
The most common failure point isn't a bad framework, it's shared ownership. When a RevOps strategy is "owned" by a committee, nothing moves when priorities conflict, because no one is actually on the hook.
The fix is a single named owner per stage of the funnel, with explicit decision rights attached, not just a title. The cost of skipping this step shows up in the numbers: Harvard Business Review's 2011 audit of 2,241 companies found an average B2B lead response time of 42 hours, and other research puts the share of leads that never get a follow-up at all as high as half. HubSpot's research found that 85% of marketers with a formal SLA consider their strategy effective, and companies with an active SLA are 34% more likely to see year-over-year ROI improvement. Most RevOps teams set the compliance bar at 90% at the team level and 85% at the individual level; below that, the SLA is really more of a suggestion.
Write Goals That Survive a Reorg
Goals tied to a specific initiative or tool die the moment that tool gets replaced or the team gets reorganized. Goals tied to a revenue outcome survive both, because the outcome still matters regardless of who's holding the pen.
This matters more than it used to. The Ebsta x Pavilion 2025 GTM Benchmarks report (655,000 opportunities, $48 billion in pipeline) found median B2B win rates fell to 19%, down from 29% the year before, and sales cycles have stretched roughly 22% longer since 2022. Healthy conversion benchmarks along the funnel run about 30% to 50% from MQL to SAL, 40% to 60% from SAL to SQL, and 20% to 30% from pipeline to closed-won. If your strategy's goals aren't framed against numbers like these, there's no way to tell whether a given quarter's dip is normal variance or a real problem.
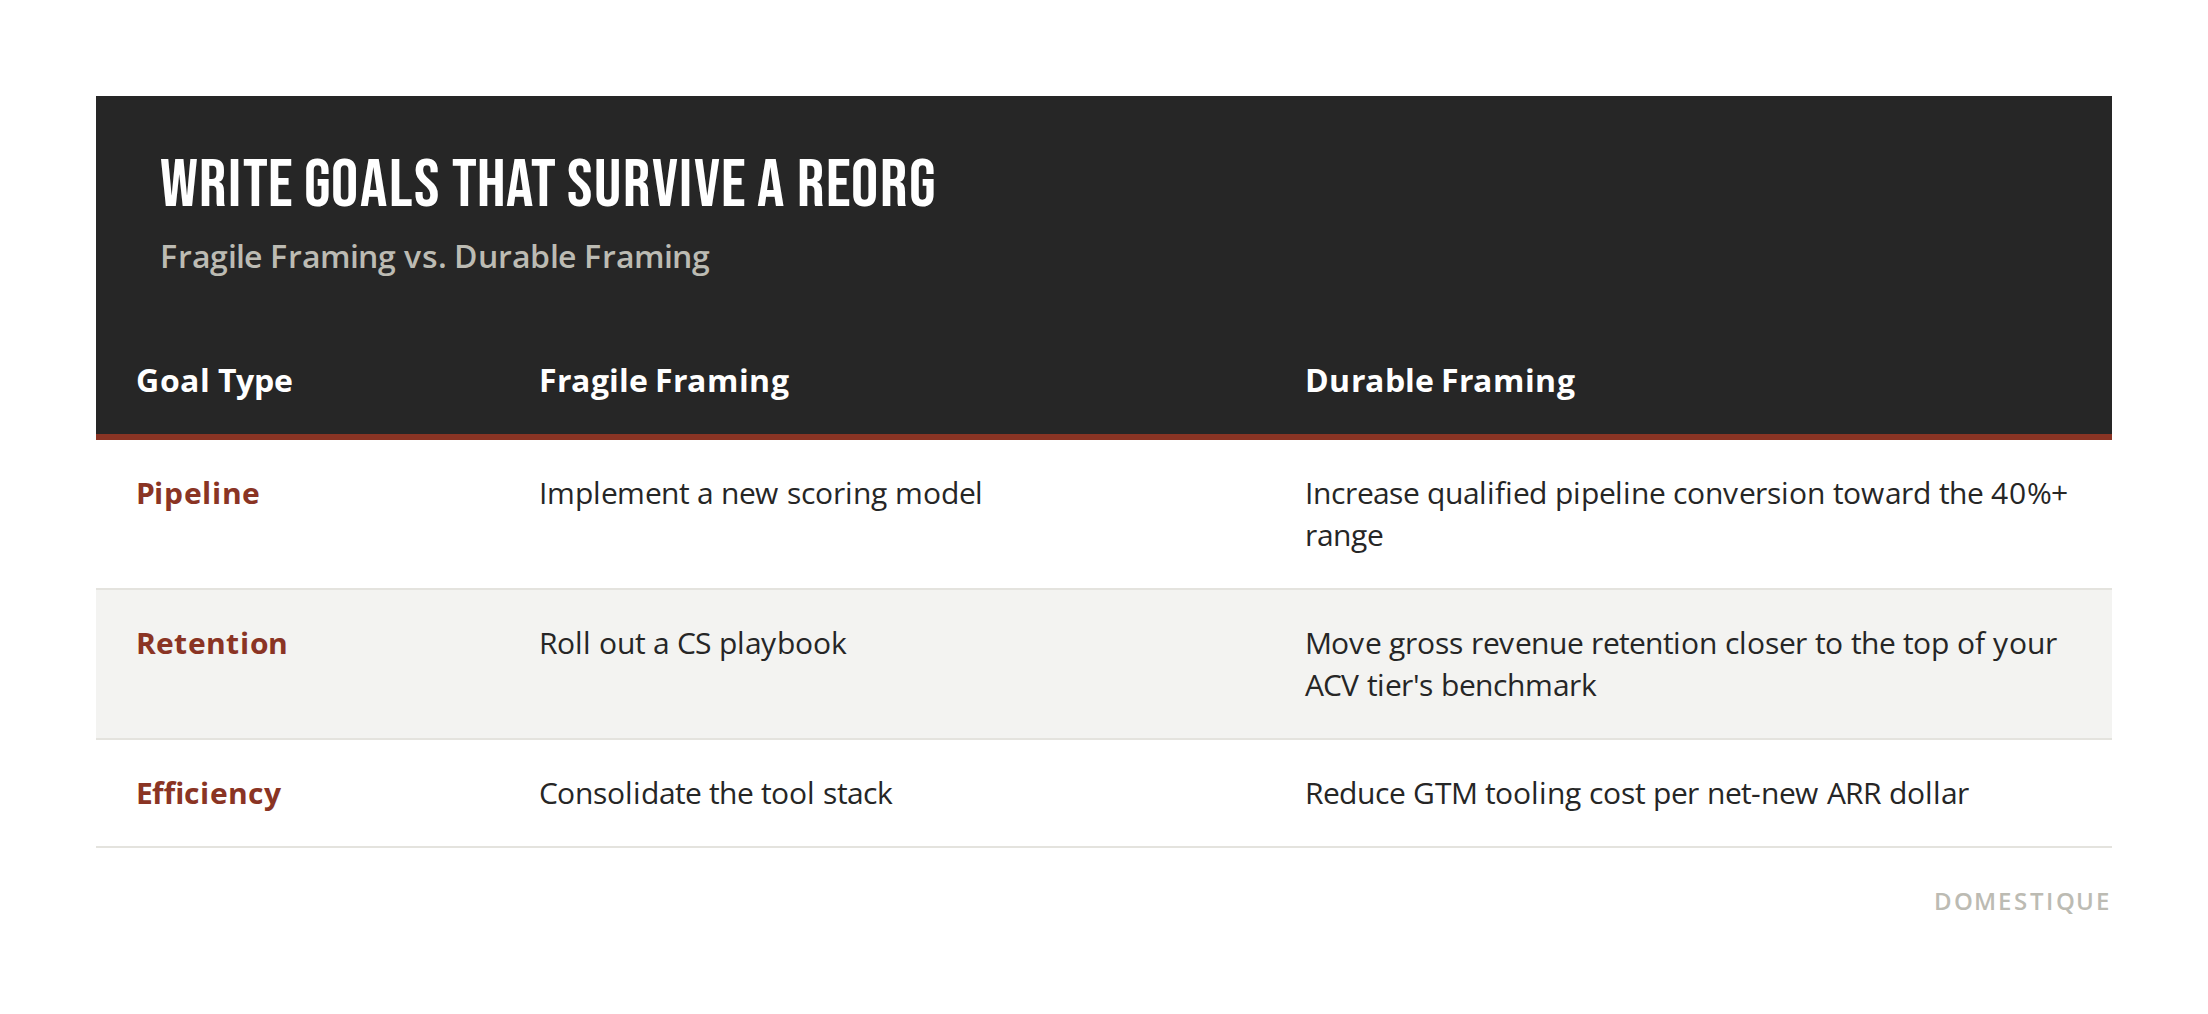
We haven't found a published benchmark that quantifies how much conversion improves specifically from switching initiative-based goals to outcome-based ones. That's a directional argument, not a measured industry number, so treat it as a framework recommendation rather than a stat.
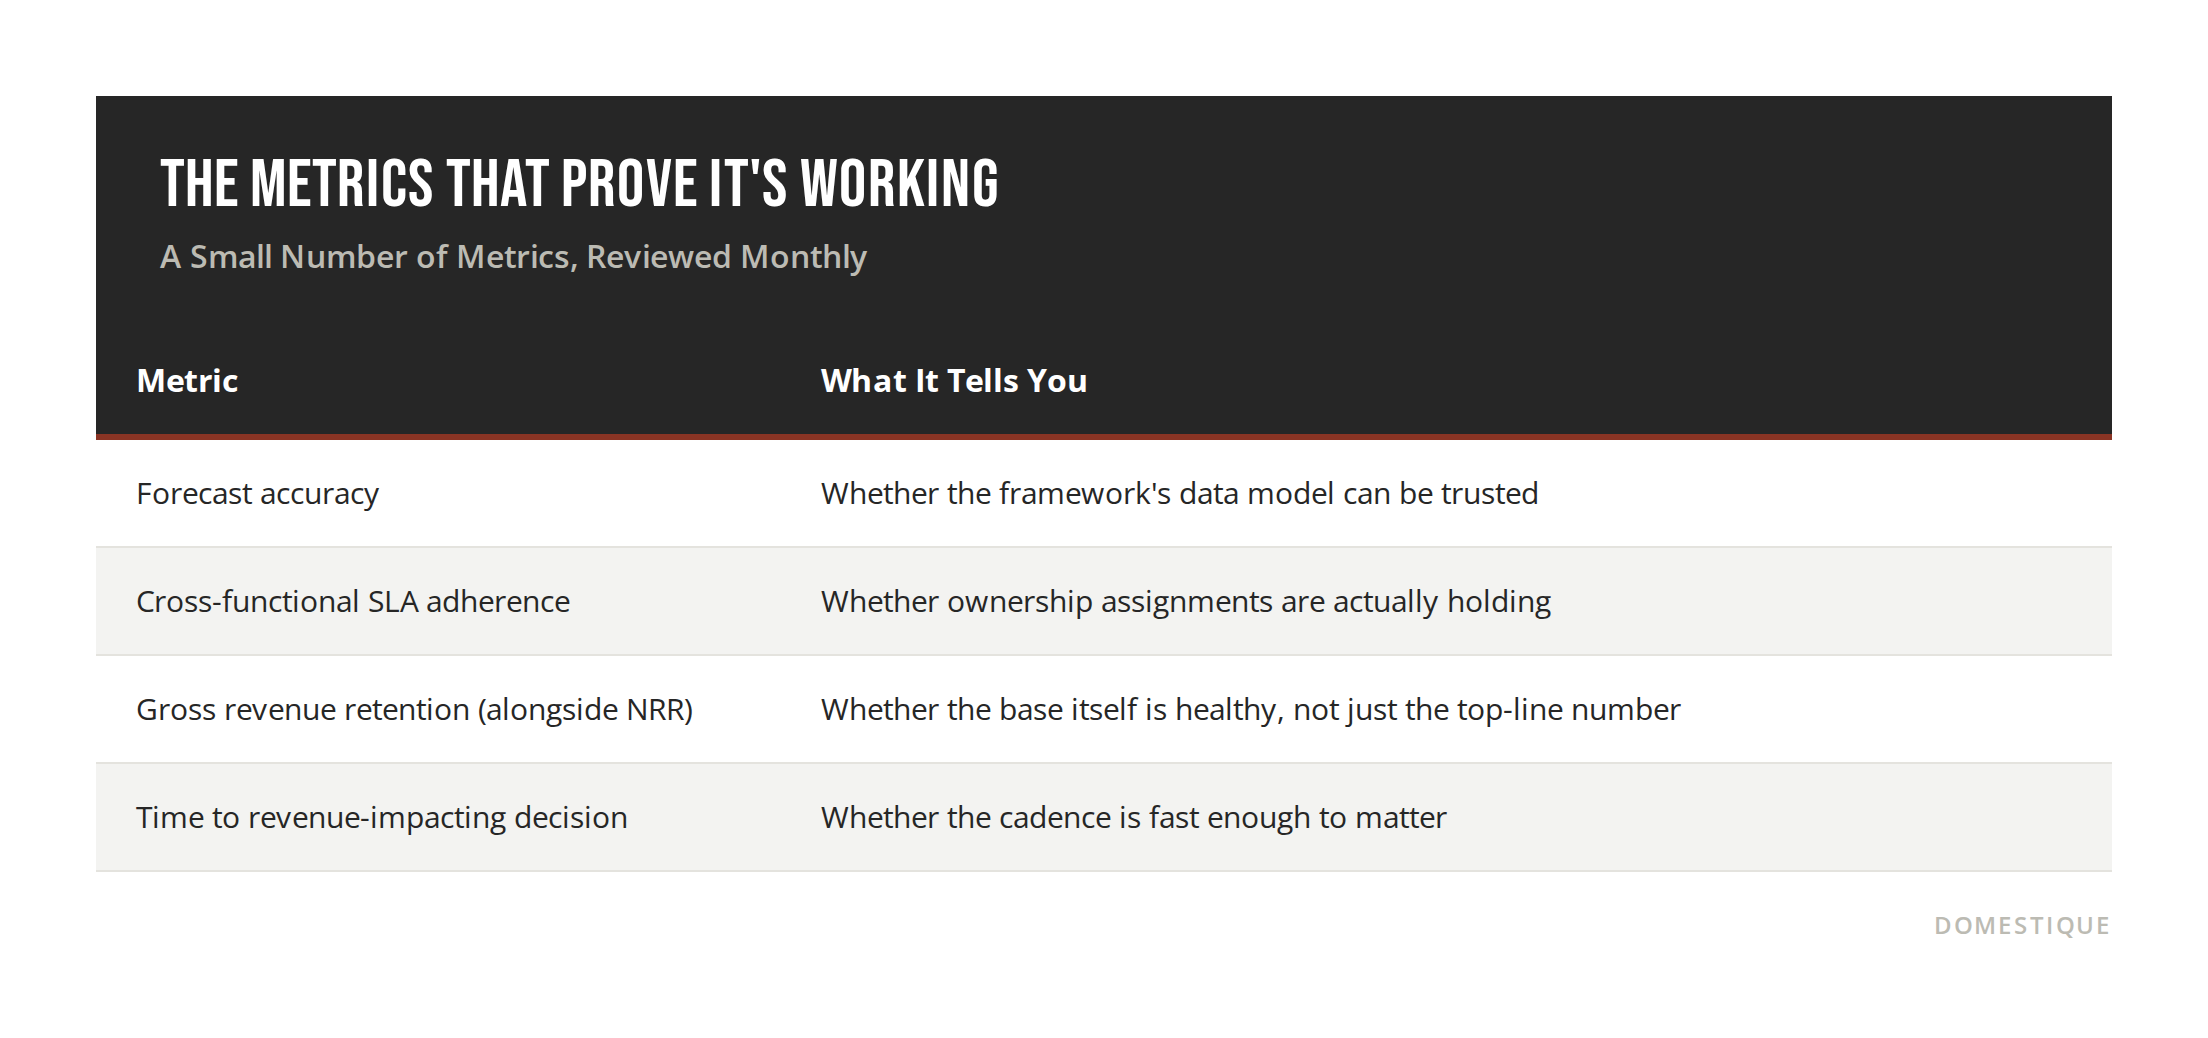
The Metrics That Prove It's Working
A strategy is only as real as what gets checked on a standing cadence. Pick a small number of metrics reviewed monthly, not a large dashboard reviewed once a quarter.
Forecast accuracy is the clearest test. The median B2B SaaS company forecasts within 10 to 20 points of actual results, and Gartner has found only 45% of sales leaders have high confidence in their own numbers. If your framework isn't moving that needle within a couple of quarters, something upstream (ownership, data, or cadence) isn't holding. Retention is a second useful check, though it's worth reading two numbers together rather than one: recent surveys put median net revenue retention for private B2B SaaS somewhere in the 101% to 106% range, while gross revenue retention typically lands lower, in the high 80s to low 90s. A business can hit a respectable NRR while still leaking gross retention underneath it, which is the number that tells you whether the base itself is healthy. Median annual logo churn sits around 3.5%, with under 5% generally considered solid footing.
We're introducing "GTM tooling cost per net-new ARR dollar" as a framework construct rather than citing it as an established industry metric. We weren't able to independently verify a solid, primary-sourced benchmark for average GTM tooling spend per rep, so use your own stack cost as the base for this ratio rather than an industry figure.
FAQ
Q: What is a RevOps framework? A: A RevOps framework is the set of goals, ownership assignments, systems, and review cadences that turn a revenue operations strategy into daily behavior, rather than leaving it as a one-time document.
Q: How is a RevOps strategy different from a RevOps framework? A: The strategy is the direction: what outcomes matter and why. The framework is the mechanism: who owns each piece, which systems support it, and how often it gets reviewed.
Q: How often should a RevOps strategy be reviewed? A: Monthly for the core metrics, and quarterly for the goals themselves. Anything reviewed less often tends to quietly stop being followed.
Q: What's the biggest reason RevOps strategies fail? A: Shared or unclear ownership. When no single person is accountable for a decision, the strategy stalls the first time two priorities conflict.
Conclusion
A RevOps strategy that survives past the kickoff meeting isn't the one with the best slides, it's the one built as an operating system: clear goals, single-threaded ownership, connected systems, and a cadence that actually gets used. Get those four pieces right and the framework runs itself instead of requiring a reunion every quarter to remember it exists.
Curious where your current framework has gaps? Take the RevOps Maturity Checklist to see which of the four components needs attention first.
Sources:
Gartner. Sales AI and forecast accuracy research (only 7% of sales organizations achieve 90%+ forecast accuracy; median accuracy 70-79%). https://www.gartner.com/en/sales/topics/sales-ai
Clari Labs. "New Clari Labs Research Reveals 87% of Enterprises Missed Revenue Targets in 2025 Despite Record AI Investment," January 14, 2026. https://www.clari.com/press/new-clari-labs-research-reveals-enterprises-missed-revenue-targets-in-2025/
Harvard Business Review / Dr. James Oldroyd. 2011 audit of 2,241 U.S. companies on lead response time (42-hour average response, 23% never respond). Widely cited secondary summary: https://www.revenue.io/inside-sales-glossary/what-is-lead-response-time
HubSpot. "How to Create an Effective Sales and Marketing SLA" (85% of marketers with an SLA rate their strategy effective; SLA companies 34% more likely to see YoY ROI gains), originally from HubSpot's State of Inbound Marketing report. https://blog.hubspot.com/marketing/how-to-align-create-an-effective-sla
Ebsta x Pavilion. 2025 GTM Benchmarks report (655,000 opportunities, $48B in pipeline; median B2B win rate fell to 19%, sales cycles up ~22% since 2022). Summarized at: https://pipelinegrader.com/insights/b2b-pipeline-cac-benchmarks
SaaS Capital. "What is a Good Retention Rate for a Private SaaS Company in 2025?" (NRR/GRR benchmarks by ACV tier). https://www.saas-capital.com/blog-posts/what-is-a-good-retention-rate-for-a-private-saas-company/
Recurly. Churn Rate Benchmarks, updated with July 2026 data (median annual churn by vertical). https://recurly.com/research/churn-rate-benchmarks/